
Impact of higher education in Yorkshire
Collectively, the twelve Yorkshire Universities member institutions make a significant economic, social and civic contribution to Yorkshire.
Data
Collectively our members…
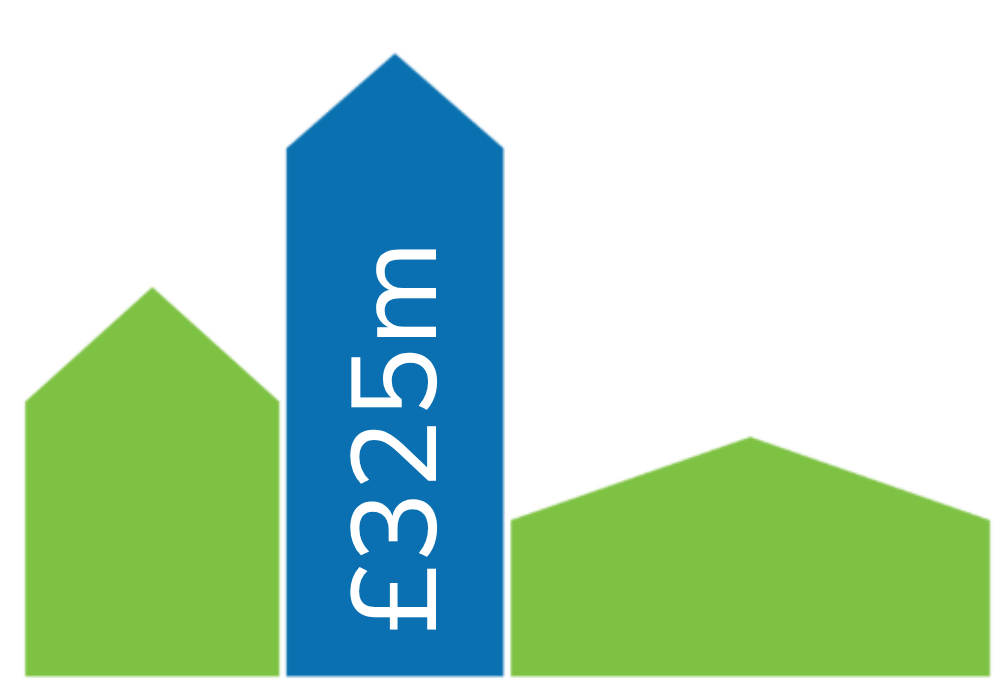
1) Invested over £325 million in capital assets in 2024/25, helping to support local regeneration and capacity building in the region.
Universities invest in residential, catering and other operational expenditure. In many cases, institutions drive major physical developments and regeneration schemes.
2) Attract a large and diverse student population from across 145 countries.
In 2024/25 the largest number of international students were from China, then India, Nigeria, Pakistan, Nepal and Malaysia.

3) Annually have over 200,000 students studying in Yorkshire.
The majority of the students are studying full-time and for their first degree. There are also more women enrolled in higher education than men.
The top most studied subject areas are: business and management, followed by subjects allied to medicine, then social sciences, then engineering and technology.

4) Start-up companies started by graduates of universities in Yorkshire and Humber, turned over £52 million in 2024/25.
The creation of UK-based businesses offer new employment opportunities, both locally and nationally.

5) Develop highly-skilled people by producing 87,335 graduates in 2024/25, creating opportunities for the region’s workforce.
In comparison, have a look at the graduate numbers in the rest of the regions:
| North East | 50,940 |
| North West | 103,190 |
| Yorkshire & Humber | 87,335 |
| West Midlands | 83,905 |
| East Midlands | 74,245 |
| East of England | 64,855 |
| London | 222,295 |
| South East | 116,780 |
| South West | 72,025 |
| Wales | 52,685 |
| Scotland | 83,055 |
| Northern Ireland | 92,235 |
| Total | 1,043,665 |
6) Support 46,000 Full Time Equivalent (FTE) jobs within member universities themselves.
Universities are often important local employers in their own right – in many cases, the largest after the NHS and local authority. In 2024/25, HEIs in Yorkshire and the Humber spent over £2 billion on staff.

7) Generated over £29 million in consultancy contracts in 2024/25.
This constitutes over 2,100 contracts: over 700 are with non-commercial organisations, over 700 with SMEs and over 650 with other commercial businesses.
8) Generated nearly £138 million in contract research in 2024/25.
This constitutes over 2,550 contracts: over 1,500 with non-commercial organisations, over 200 with SMEs and over 750 with other commercial businesses.
9) Obtained over £174 million in collaborative research in 2024/25.
This includes public funding, in cash and in-kind collaboration contributions.
10) Over 44,000 people access museum and gallery exhibitions ran by universities in the region in 2024/25.
The Yorkshire and Humber region is rich in culture. Universities in the region run a number of creative and historic exhibitions accessible to the public.
11) Public lectures hosted by HEIs in the region welcomed over 44,000 attendees, in 2024/25.
Higher education institutions of all types, across the region, are providing lectures to the wider community.

As anchor institutions, they are working together to support local councils, NHS and businesses and play a vital role in the region’s civic, social and cultural life through community outreach and volunteering, creating accessible and vibrant public places through libraries, arts and sporting facilities.
Facing the challenges posed by the climate emergency and Covid-19, universities alongside further education have been playing a crucial role in formulating economic recovery plans, helping to reskill adults, supporting local businesses and start-ups, and in driving locally focussed research and innovation.
Sources
Find source of each data point in the hyperlinked text. You can also find the list below.
Data 1
Higher Education Statistics Agency. (2024/25). Table 9 – Capital expenditure 2015/16 to 2024/25. Available at: https://www.hesa.ac.uk/data-and-analysis/finances/table-9
Higher Education Statistics Agency. (2024/25). Table 8 – Expenditure – breakdown by HE provider, activity, HESA cost centre and academic year 2015/16 to 2024/25. Available at: https://www.hesa.ac.uk/data-and-analysis/finances/table-8
Data 2
Higher Education Statistics Agency. (2024/25). Table 28 – Non-UK permanent address students by HE provider and country of permanent address 2014/15 to 2024/25. Available at: https://www.hesa.ac.uk/data-and-analysis/students/table-28
Data 3
Higher Education Statistics Agency. (2024/25). Table 1 – HE student enrolments by HE provider 2014/15 to 2024/25. Available at: https://www.hesa.ac.uk/data-and-analysis/students/table-1
Higher Education Statistics Agency. (2024/25). Table 49 – HE student enrolments by HE provider and subject of study 2014/15 to 2024/25. Available at: https://www.hesa.ac.uk/data-and-analysis/students/table-49
Data 4
Higher Education Statistics Agency. (2024/25). Table 4e – Spin-out, start-up and social enterprise activities by HE provider 2014/15 to 2024/25. Available at: https://www.hesa.ac.uk/data-and-analysis/providers/business-community/table-4e
Data 5
Higher Education Statistics Agency. (2024/25). Table 16 – HE qualifiers by HE provider and level of qualification obtained 2014/15 to 2024/25. Available at: https://www.hesa.ac.uk/data-and-analysis/students/table-16
Data 6
Higher Education Statistics Agency. (2024/25). Table 6 – HE Staff FTE by HE provider and activity standard occupational classification 2014/15 to 2024/25. Available at: https://www.hesa.ac.uk/data-and-analysis/staff/table-6
Higher Education Statistics Agency. (2024/25). Table 1 – Consolidated statement of comprehensive income and expenditure 2015/16 to 2024/25. Available at: https://www.hesa.ac.uk/data-and-analysis/finances/table-1
Data 7
Higher Education Statistics Agency. (2024/25). Table 2a – Business and community services by HE provider 2014/15 to 2024/25. Available at: https://www.hesa.ac.uk/data-and-analysis/providers/business-community/table-2a
Data 8
Higher Education Statistics Agency. (2024/25). Table 2c – Contract research by HE provider 2014/15 to 2024/25. Available at: https://www.hesa.ac.uk/data-and-analysis/providers/business-community/table-2c
Data 9
Higher Education Statistics Agency. (2024/25). Table 1 – Income from collaborative research involving public funding by HE provider 2015/16 to 2024/25. Available at: https://www.hesa.ac.uk/data-and-analysis/providers/business-community/table-1
Data 10
Higher Education Statistics Agency. (2024/25). Table 5 – Social, community and cultural engagement: Designated public events by HE provider 2014/15 to 2024/25. Available at: https://www.hesa.ac.uk/data-and-analysis/providers/business-community/table-5
Data 11
Higher Education Statistics Agency. (2024/25). Table 5 – Social, community and cultural engagement: Designated public events by HE provider 2014/15 to 2024/25. Available at: https://www.hesa.ac.uk/data-and-analysis/providers/business-community/table-5
Updates
The page was last updated on Wednesday 26 August 2026.